

Data is king in today’s world. Fortunately, you do not have to be a data scientist to gain some useful insights from the data all around you. There are millions of small data opportunities that you can easily take advantage of right now. These small data opportunities can help you improve your own work or uncover interesting insights that add value to the overall organization.
Consider Your Question
The first thing to do is consider your question. This is the question you want to answer. You can consider things that upset you, nag at you, or that you are just curious about. Your question could be something simple like how long it takes to put together a presentation, or something more complex like how many widgets should the company produce. For starters, try to stick to simple business questions until you have the hang of doing some basic data analysis.
Next, you want to collect the data. This may be relatively easy if the data already exists. More likely, data does not exist so you have to think about how you will gather it. This means you have to consider what is relevant to your question. Using our presentation example, think about when the process actually starts. Is it when your manager asks you to create a presentation or is when you open up PowerPoint? This is important, so consider definitions carefully. Definitions may change as you go along (e.g., perhaps the presentation delivery date changes, and that alters work on the presentation).
Explore the Data
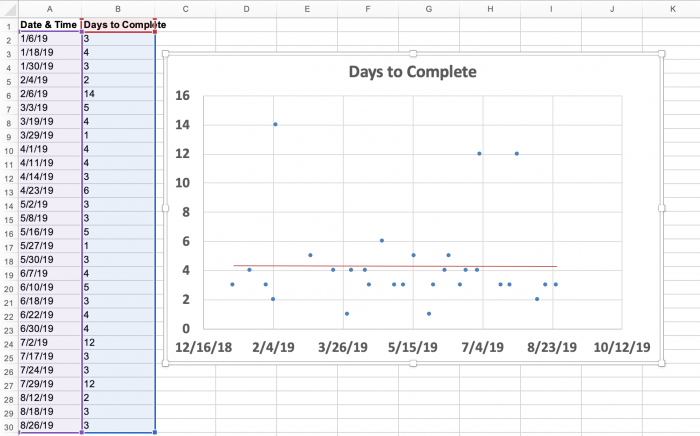
Once you have some data collected, you can start plotting it. Excel is an excellent tool. Most business users have access to it and it will do the heavy lifting for you. Collecting your data into an Excel spreadsheet is pretty straightforward. Typically I have one column for the data and time, and another for what I am interested in—time to create the presentation. This allows you to create something called a time-series plot. The horizontal axis (y-axis) is the data and time, and the vertical axis (x-axis) is your variable, time to complete the presentation.
With these two columns, Excel can do the rest. Select and highlight the data in your Excel sheet. It is okay to include the column labels. Then select “Insert” from the top menu and select a scatter plot. Excel will automatically plot your data. Next, adding a trend line will provide some insight into the data. Select “Chart Design” from the top menu and click add “Chart Element.” From the dropdown, choose “Trendline” and click “Linear.” This line will pass through the mid-point of all of the plots. In my example below, you will not that it takes just over four days to complete a presentation.
Ask Questions About Your Data
Okay, great. You have a time-series plot. You see that presentations take an average of four days to complete. So what? What is that important? Perhaps it is important to start the process sooner to avoid a frantic rush of getting the prevention finished in time? Maybe it makes more sense to have a standard template created to work from in order to save time? After all, time is money—if I make $X/hour, my time is better spent on something else. This “So what?” question is the critical point of the analysis.
Consider other aspects of the data. The average might be four days, but maybe there is a lot of variability in the data. Maybe most presentations only take four days and a few other take much longer. Then you might find that for most presentations you do not need as long to prepare, but for others it is best to start earlier. Again, ask yourself why. Digging into the data and asking questions will help you uncover additional insights. Maybe only the presentations that involve a particular executive require more time.
While this exercise will likely provide some valuable insights, be careful not to go too far. Small data sets are limited in their scope. If you find something of interest with your small data, you can use that develop a proposal for a more robust study and analysis in a larger business question. Small data opportunities abound. Ask questions and use these small data opportunities to answer them.